What So-Called Statistical “Value Premium?”
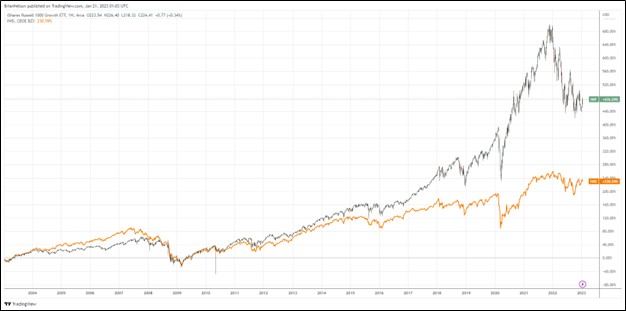
Image: The iShares Russell 1000 Growth ETF has outperformed the iShares Russell 1000 Value ETF by nearly 250 percentage points over the past two decades. Image Source: TradingView
By Brian Nelson, CFA
Quantitative analysts are trained to believe that the quantitative stylistic area of “value” outperforms (and generally should outperform) the quantitative stylistic area of “growth” over long periods of time.
After all, this was one of the findings of University of Chicago Eugene Fama’s three-factor model, published in the early 1990s--that on a historical basis through the time of the publishing of the influential backtest, that stocks with high book-to-market (low price-to-book) ratios--so-called “value” stocks--outperformed those with low book-to-market (high price-to-book) ratios--so-called “growth” stocks--with emphasis placed on the work being a well-known example of an empirical, evidenced-based backtest (1).
It has thus become a widely-held view that Fama’s empirical, evidenced-based backtest, which was conducted in the early 1990s, suggests that those stocks whose market capitalizations aren’t that much higher than their book values (so-called “value stocks”) may have the prospect of better returns over time than those stocks whose market capitalizations are much, much higher than their book values (so-called “growth stocks”). This is a fairly straightforward, insightful observation based on tons of data-driven analysis conducted by one of the top statistical minds the world has seen at one of the most prestigious universities in the world.
It's about as strong of an empirical, evidenced-based backtest out there. The conclusion then goes that investors may be rewarded in the future with a higher return over time by investing in stocks with low price-to-book (high book-to-market) ratios because of (something in finance that has come to be called) a “value premium.” There’s not a lot of strong theory behind why investors should expect this so-called statistical “value premium” to drive an expected higher return over time, other than, well, it’s just what the data had suggested by the backtest in the early 1990s on the basis of market returns that had already happened.
Besides the price-to-book (book-to-market) ratio, there are other ways to measure so-called “value” stocks, too, such as with a price-to-earnings (P/E) ratio, price-earnings-to-growth (PEG) ratio, price-to-sales (P/S) ratio, EV-EBITDA, EV/EBITDAR, and the list goes on and on and on. In some ways, there are perhaps hundreds (maybe thousands) of quantitative metrics out there that can be considered “value” metrics. As a result, it has become very difficult for investors to discern what exactly they are getting in a “value” ETF or “value” stock, or even whether that so-called statistical “value premium” is even being targeted.
But all of this may be just a bunch of hot air anyway.
Why? Well, in light of the many metrics one can use to measure “value” and the many ways indexes can sort these metrics to determine so-called “value” stocks, it stands to reason that there’s just not much substance behind the conversation of “value” versus “growth (2).” With all these various possiblities, where perhaps any stock can be considered a “value” stock under the right light of the statistician, the "value" versus "growth" conversation becomes quite arbitrary--and you’ll even find some of the same stocks across both “value” and “growth” indices, even with the same index provider.
That there are not really “value” and “growth” stocks is one of the major themes of our book Value Trap. A company with a high price-to-book ratio can be undervalued, while a company with a low price-to-book ratio can be overvalued. There’s a lot more that goes into a “value” assessment than the consideration of one, two, three, or five quantitative “value” ratios. What matters in determining what one might consider to be a true definition of value is, instead, an estimate of the company’s forward-looking, cash-flow-based intrinsic value derived by the discounted cash-flow model (DCF) versus its market price (3). In Warren Buffett’s 1992 Letter to Berkshire Shareholders, there is an excerpt that shows that Buffett is not a “value” investor, but rather an intrinsic value investor, a definition that may include either statistical “value” or “growth” stocks.
Here’s Buffett from 1992:
Our equity-investing strategy remains little changed from what it was fifteen years ago, when we said in the 1977 annual report: "We select our marketable equity securities in much the way we would evaluate a business for acquisition in its entirety. We want the business to be one (a) that we can understand; (b) with favorable long-term prospects; (c) operated by honest and competent people; and (d) available at a very attractive price." We have seen cause to make only one change in this creed: Because of both market conditions and our size, we now substitute "an attractive price" for "a very attractive price."
But how, you will ask, does one decide what's "attractive"? In answering this question, most analysts feel they must choose between two approaches customarily thought to be in opposition: "value" and "growth." Indeed, many investment professionals see any mixing of the two terms as a form of intellectual cross-dressing.
We view that as fuzzy thinking (in which, it must be confessed, I myself engaged some years ago). In our opinion, the two approaches are joined at the hip: Growth is always a component in the calculation of value, constituting a variable whose importance can range from negligible to enormous and whose impact can be negative as well as positive.
In addition, we think the very term "value investing" is redundant. What is "investing" if it is not the act of seeking value at least sufficient to justify the amount paid? Consciously paying more for a stock than its calculated value - in the hope that it can soon be sold for a still-higher price - should be labeled speculation (which is neither illegal, immoral nor - in our view - financially fattening).
Whether appropriate or not, the term "value investing" is widely used. Typically, it connotes the purchase of stocks having attributes such as a low ratio of price to book value, a low price-earnings ratio, or a high dividend yield. Unfortunately, such characteristics, even if they appear in combination, are far from determinative as to whether an investor is indeed buying something for what it is worth and is therefore truly operating on the principle of obtaining value in his investments. Correspondingly, opposite characteristics - a high ratio of price to book value, a high price-earnings ratio, and a low dividend yield - are in no way inconsistent with a "value" purchase.
Similarly, business growth, per se, tells us little about value. It's true that growth often has a positive impact on value, sometimes one of spectacular proportions. But such an effect is far from certain. For example, investors have regularly poured money into the domestic airline business to finance profitless (or worse) growth. For these investors, it would have been far better if Orville had failed to get off the ground at Kitty Hawk: The more the industry has grown, the worse the disaster for owners.
Growth benefits investors only when the business in point can invest at incremental returns that are enticing - in other words, only when each dollar used to finance the growth creates over a dollar of long-term market value. In the case of a low-return business requiring incremental funds, growth hurts the investor.
In The Theory of Investment Value, written over 50 years ago, John Burr Williams set forth the equation for value, which we condense here: The value of any stock, bond or business today is determined by the cash inflows and outflows - discounted at an appropriate interest rate - that can be expected to occur during the remaining life of the asset. Note that the formula is the same for stocks as for bonds. Even so, there is an important, and difficult to deal with, difference between the two: A bond has a coupon and maturity date that define future cash flows; but in the case of equities, the investment analyst must himself estimate the future "coupons." Furthermore, the quality of management affects the bond coupon only rarely - chiefly when management is so inept or dishonest that payment of interest is suspended. In contrast, the ability of management can dramatically affect the equity "coupons."
The investment shown by the discounted-flows-of-cash calculation to be the cheapest is the one that the investor should purchase - irrespective of whether the business grows or doesn't, displays volatility or smoothness in its earnings, or carries a high price or low in relation to its current earnings and book value. Moreover, though the value equation has usually shown equities to be cheaper than bonds, that result is not inevitable: When bonds are calculated to be the more attractive investment, they should be bought.
Brian here again. Quite simply, if the intrinsic value estimate of a stock is above that of the company’s share price, the company could be considered value, or rather undervalued, while the opposite would be true. Overvalued stocks need not be high multiple stocks for any number of reasons. Overvalued stocks could be ultra-cyclical entities (with high current earnings and low P/Es), have high net debt positions that weigh down their equity values within the intrinsic value construct, or have contingent liabilities on the horizon that hurt a probabilistic weighting of an intrinsic value estimate. Regardless, most quantitative analysts don’t consider this important DCF dynamic in their work, but we’re hoping that they will…eventually. Read Value Trap.
But let’s get back to this so-called “value premium.”
For the sake of entertainment, let’s just assume that one of the largest index providers, Blackrock (BLK), Inc. is doing things right, or at least doing things in some ways how the quants might have intended to divvy up “value” and “growth” stocks. The iShares Russell 1000 Value ETF (IWD) has a price-to-book ratio of 2.21, as of January 19, 2023, while the iShares Russell 1000 Growth ETF (IWF) has a price-to-book ratio of 8.82 at the same time. It seems the quants might agree that these ETFs are decent representations of what might have been intended for the layman to capture a so-called statistical “value premium.” After all, the IWD (“value”) has low price-to-book stocks, while the IWF (“growth”) has much higher price-to-book stocks. So how has the IWF (“growth”) performed relative to the IWD (“value”) the past 20 years?
Well, the IWF (“growth”) is up more than 480% while the IWD (“value”) is up more than 230%, meaning that the return of “growth” stocks has more than doubled the return of “value” stocks the past two decades. 20 years is a very, very long time, and the magnitude of the difference in return between “growth” and “value” over this time period is huge, so one might lose patience with the argument that the time horizon is too small. How long, for example, would it take for “growth” to lose this 20-year outperformance, and let’s say it does happen, things between “value” and “growth” would then just be at parity – with equivalent returns. We’ve now arrived at the takeaway: This isn’t a write-up on whether “growth” is better than “value,” or vice-versa, but rather the key takeaway is that there are not really "value" and "growth" stocks on the basis of a so-called statistical "value premium."
Quite simply, “growth” trouncing “value” the past two decades is simply not what the quants expected back in the early 1990s with their empirical, evidence-based backtest based on historical realized data, and the walk-forward findings over the past 20 years brings into question, at least from our perspective, the informational value of empirics entirely, especially when stock prices and returns are in (large) part a function of changes in future expectations (within the DCF). Adding on to the failures of the so-called statistical “value premium” the past two decades is the collapse of the 60/40 stock/bond portfolio during 2022, which is yet another blow to the founding fathers of quantitative finance. In the second edition of Value Trap, we talk about how the 60/40 stock/bond portfolio has come up short the past 30 years, and almost on cue, the portfolio failed when diversification and drawdown mitigation risk was perhaps needed the most.
This article shows that there may be hundreds, if not thousands, of ways to measure “value” versus “growth,” and different time horizons can be used to tell different stories about “value” versus “growth," but we think a 20-year horizon using the IWD versus the IWF is a great example of why relying blindly on empirical, evidence-based analysis within backtests employing realized historical data can be quite painful. Whatever one believes, however, the intelligent investor shouldn’t be surprised by any of the findings in this article. In the field of finance, there’s just not much substance behind empirical, evidence-based, backtests that are based solely on realized historical data, in our view, when markets themselves are in (large) part a function of future expectations of “coupons,” as Warren Buffett explains.
---
(1) Empirical analysis is successfully relied upon in the physical sciences, but its usefulness in the behavioral sciences, as in the field of finance, is mixed at best, and we say this generously.
(2) Statistical “value” stocks tend to be financials and energy, while statistical “growth” stocks tend to be asset light technology-oriented equities. In this case, those betting on “value” are betting on cyclical energy and regulatory-driven financials, while those betting on “growth” are betting more on long-term economic expansion driven by technological advances. On this analysis alone, it’s hard not to favor “growth” stocks in the long run.
(3) Yes, the DCF is very much alive and well. That’s why, in part, stocks have faced pressure since the beginning of 2022—a rise in the 10-year Treasury rate increases the discount rate within DCF models.

Brian Nelson owns shares in SPY, SCHG, QQQ, DIA, VOT, BITO, RSP, and IWM. Valuentum owns SPY, SCHG, QQQ, VOO, and DIA. Brian Nelson's household owns shares in HON, DIS, HAS, NKE, DIA, and RSP. Some of the other securities written about in this article may be included in Valuentum's simulated newsletter portfolios. Contact Valuentum for more information about its editorial policies.
Valuentum members have access to our 16-page stock reports, Valuentum Buying Index ratings, Dividend Cushion ratios, fair value estimates and ranges, dividend reports and more. Not a member? Subscribe today. The first 14 days are free.
0 Comments Posted Leave a comment